Cities of Champions
- UI/UX
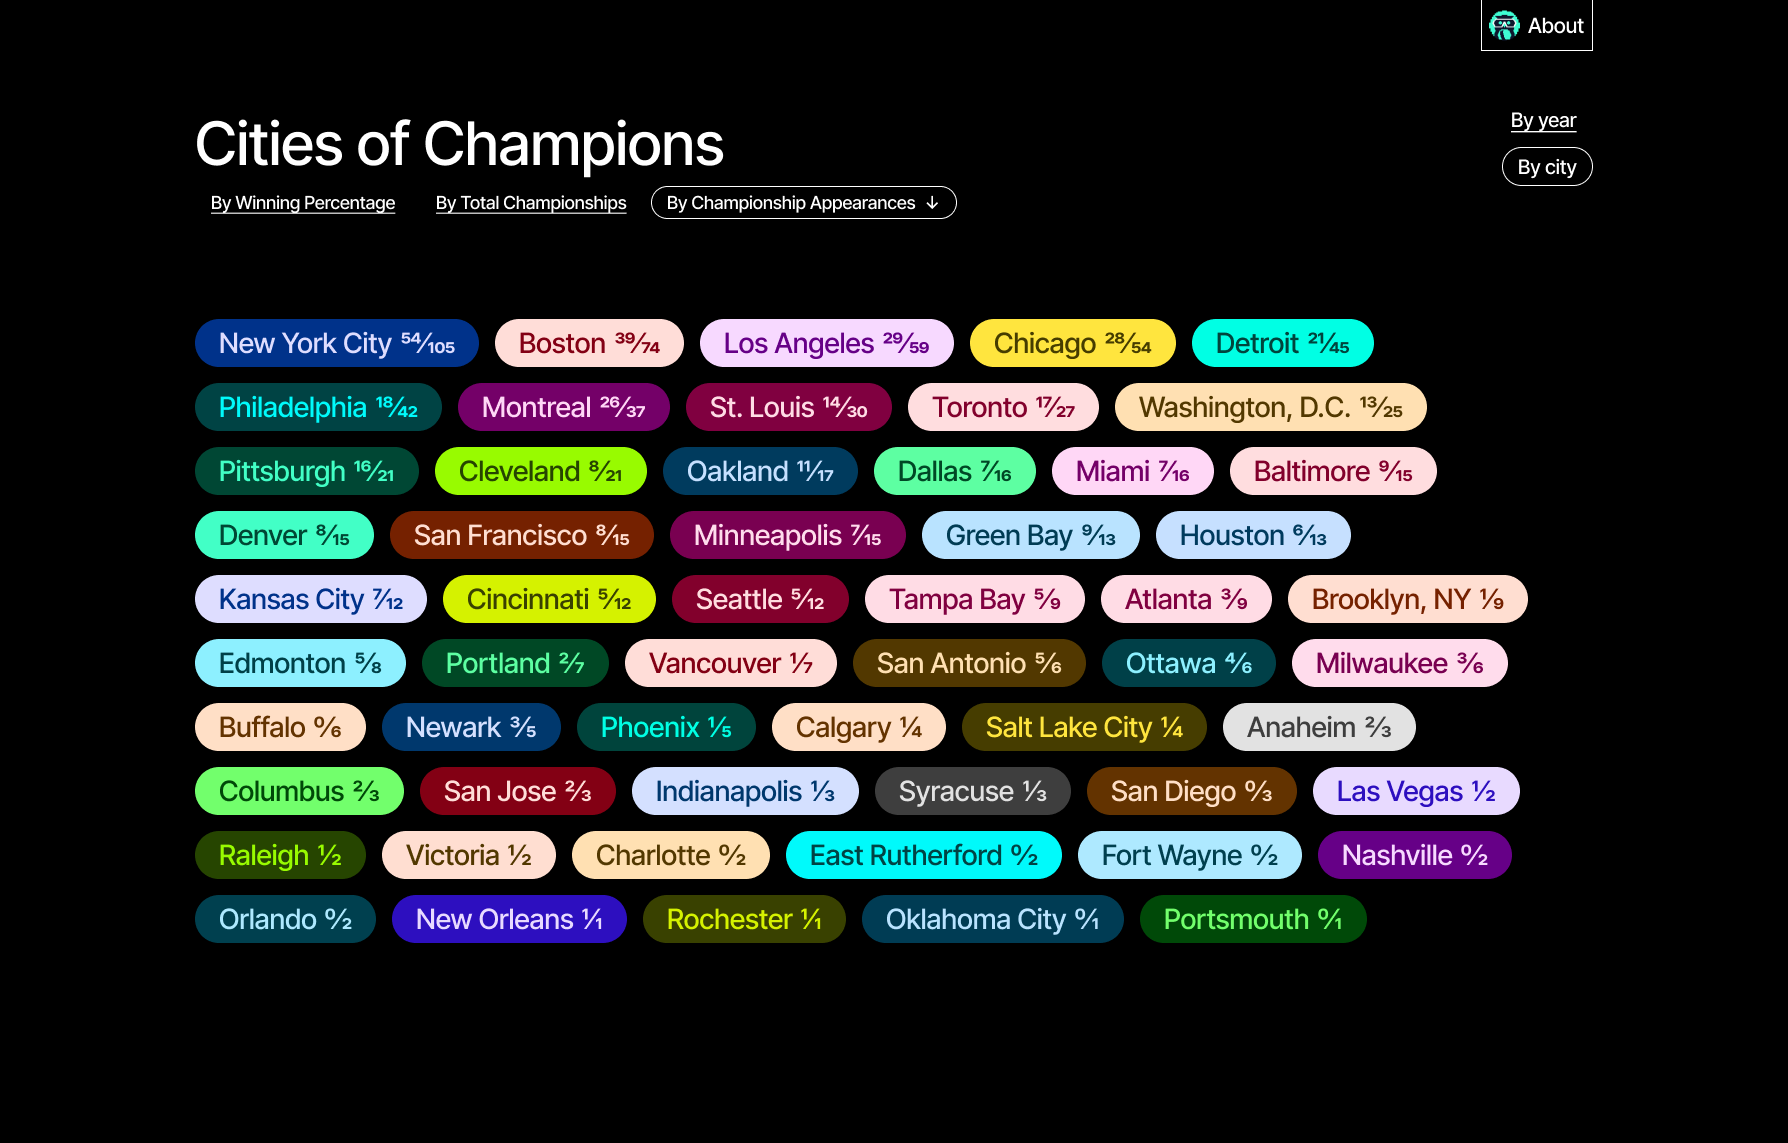
Charting the successes of North American cities in sporting championships.
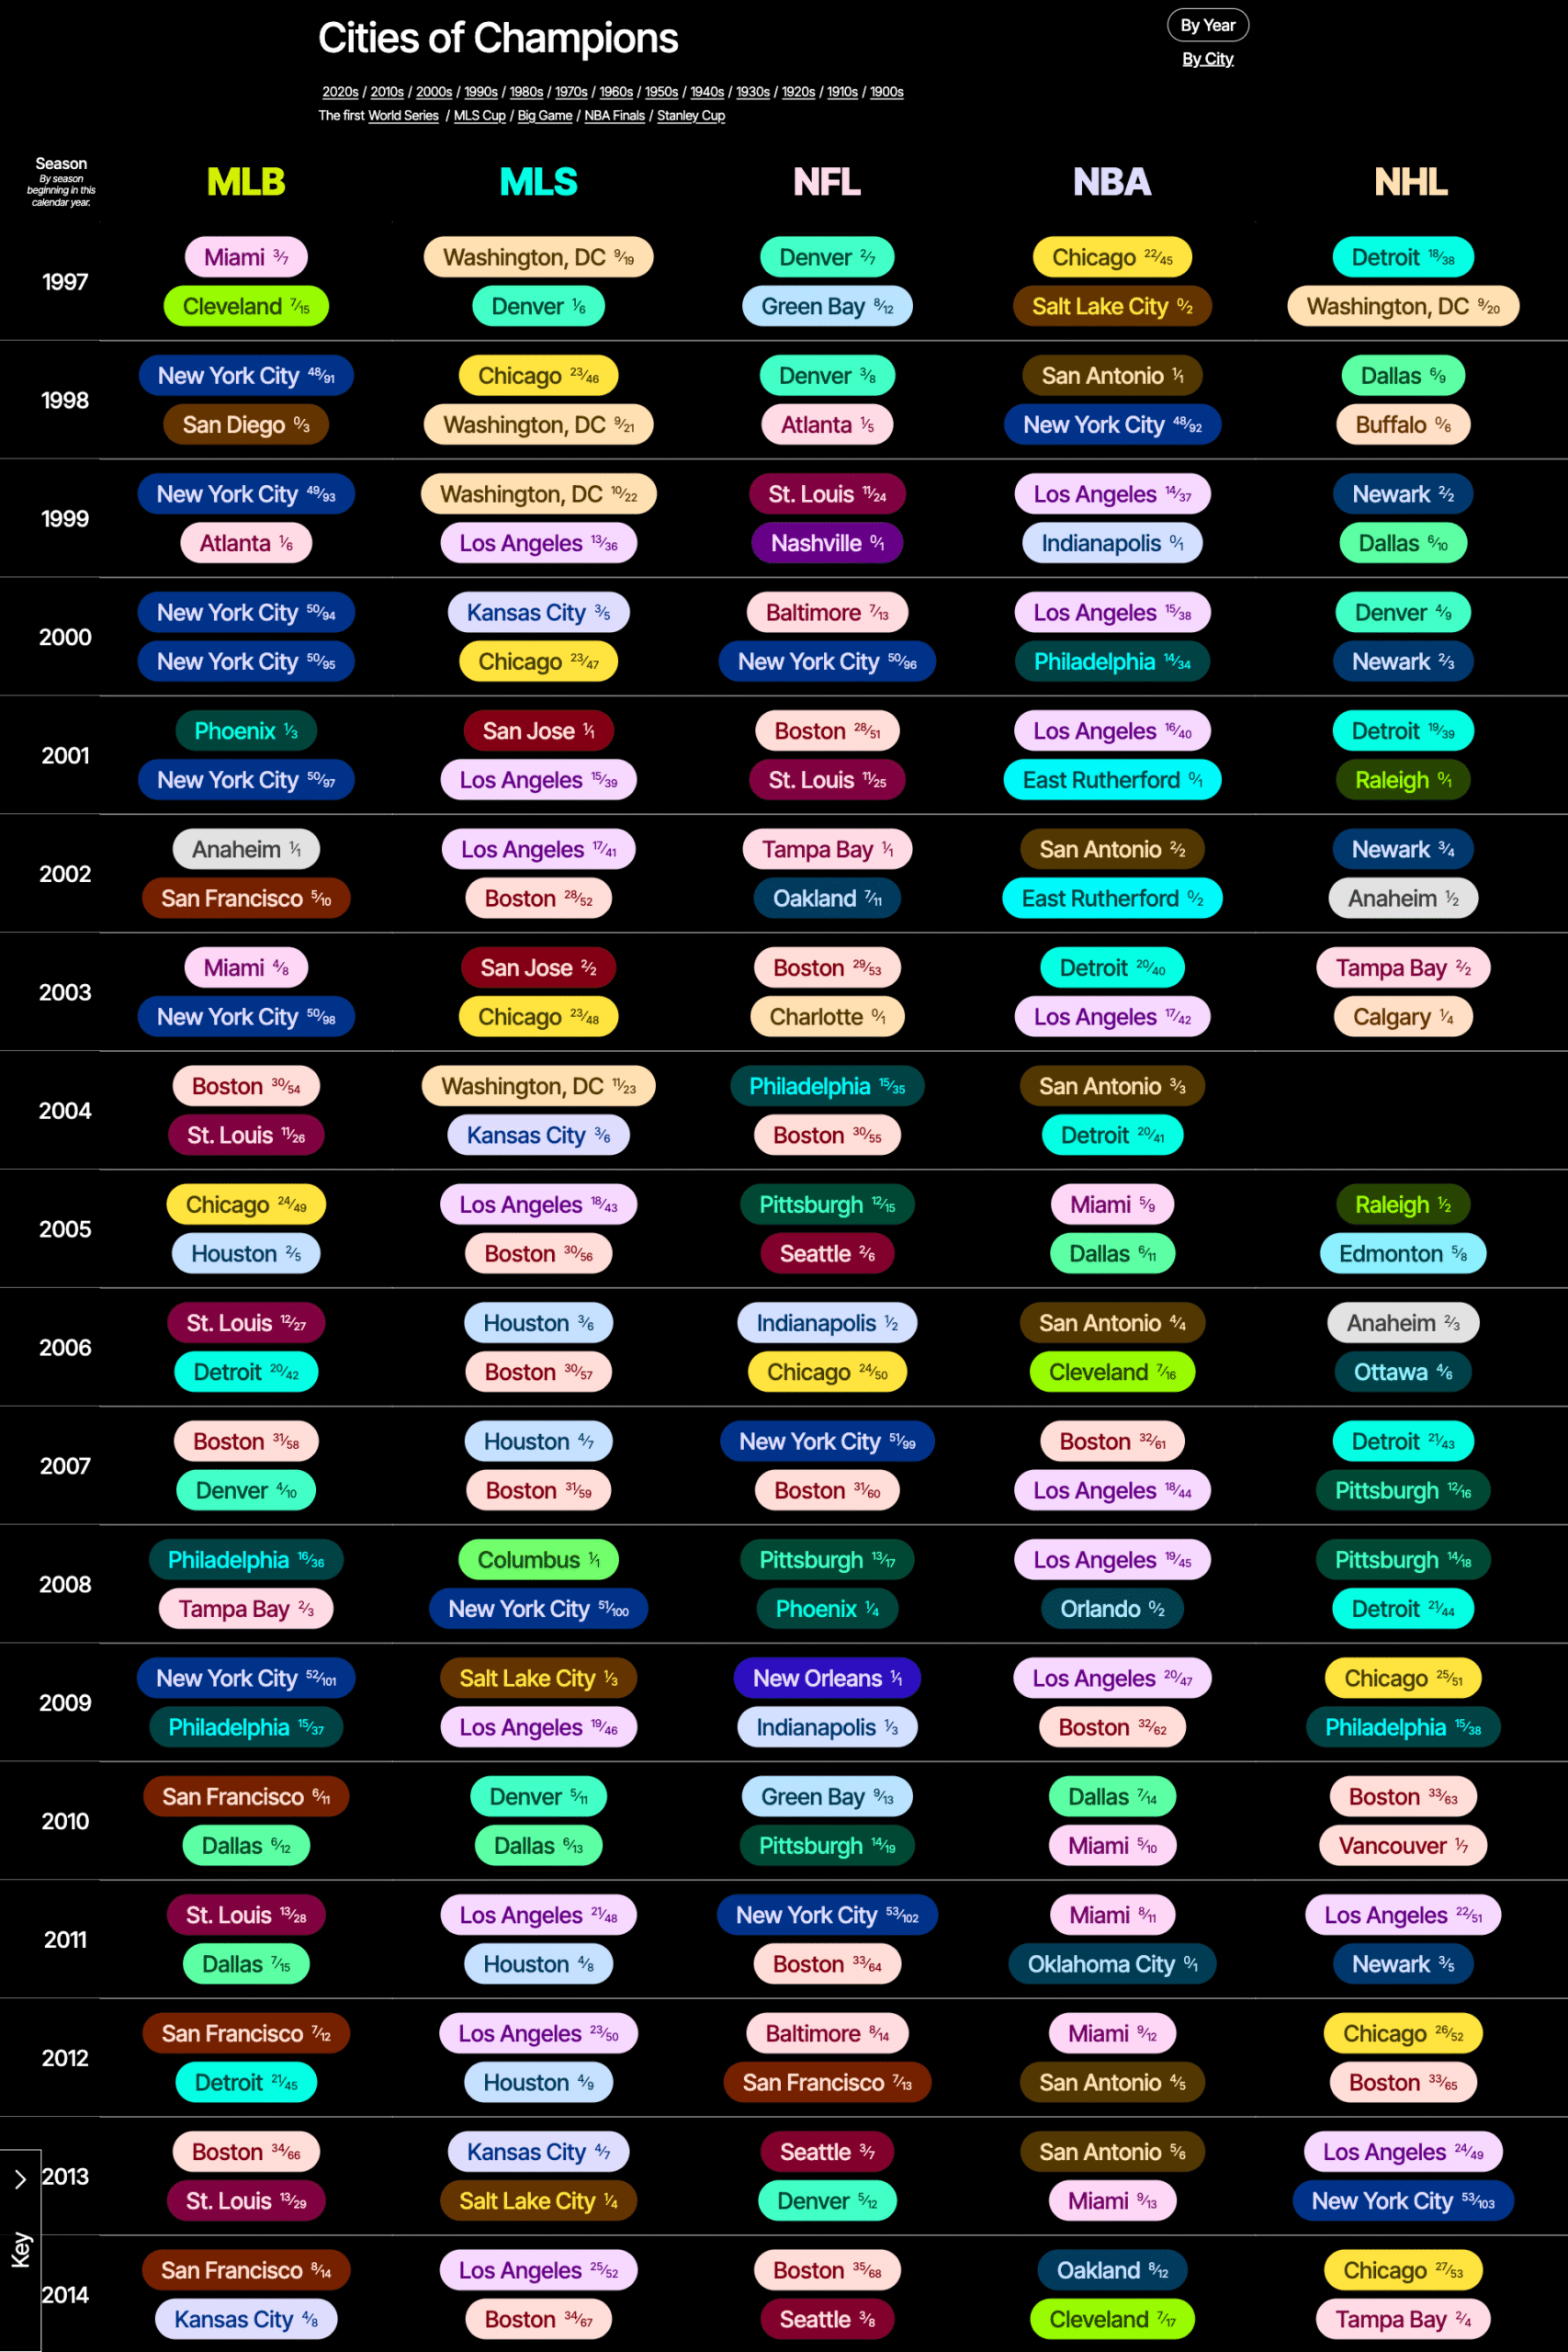
Cities of Champions is a data visualization tracking the successes of cities in North American sports through a geographical lens rather than through individual sports franchises. The data collection covers professional men's leagues for baseball, soccer, American football, basketball, and hockey.
This idea came to me as I was watching the 2023 NBA Finals and Stanley Cup Playoff Finals concurrently. The Denver Nuggets were playing the Miami Heat, and the Vegas Golden Knights were playing the Florida Panthers. Miami was the link between these two events, and I became curious about how often this happened previously. To begin, I collected data into an Airtable of championship matchups across the five major men's sports. Some interesting things that jumped out were how often New York City played against itself, and how precise I should be when separating a New York City borough from the city at large. I made the call to go off the team's demonym when unsure.
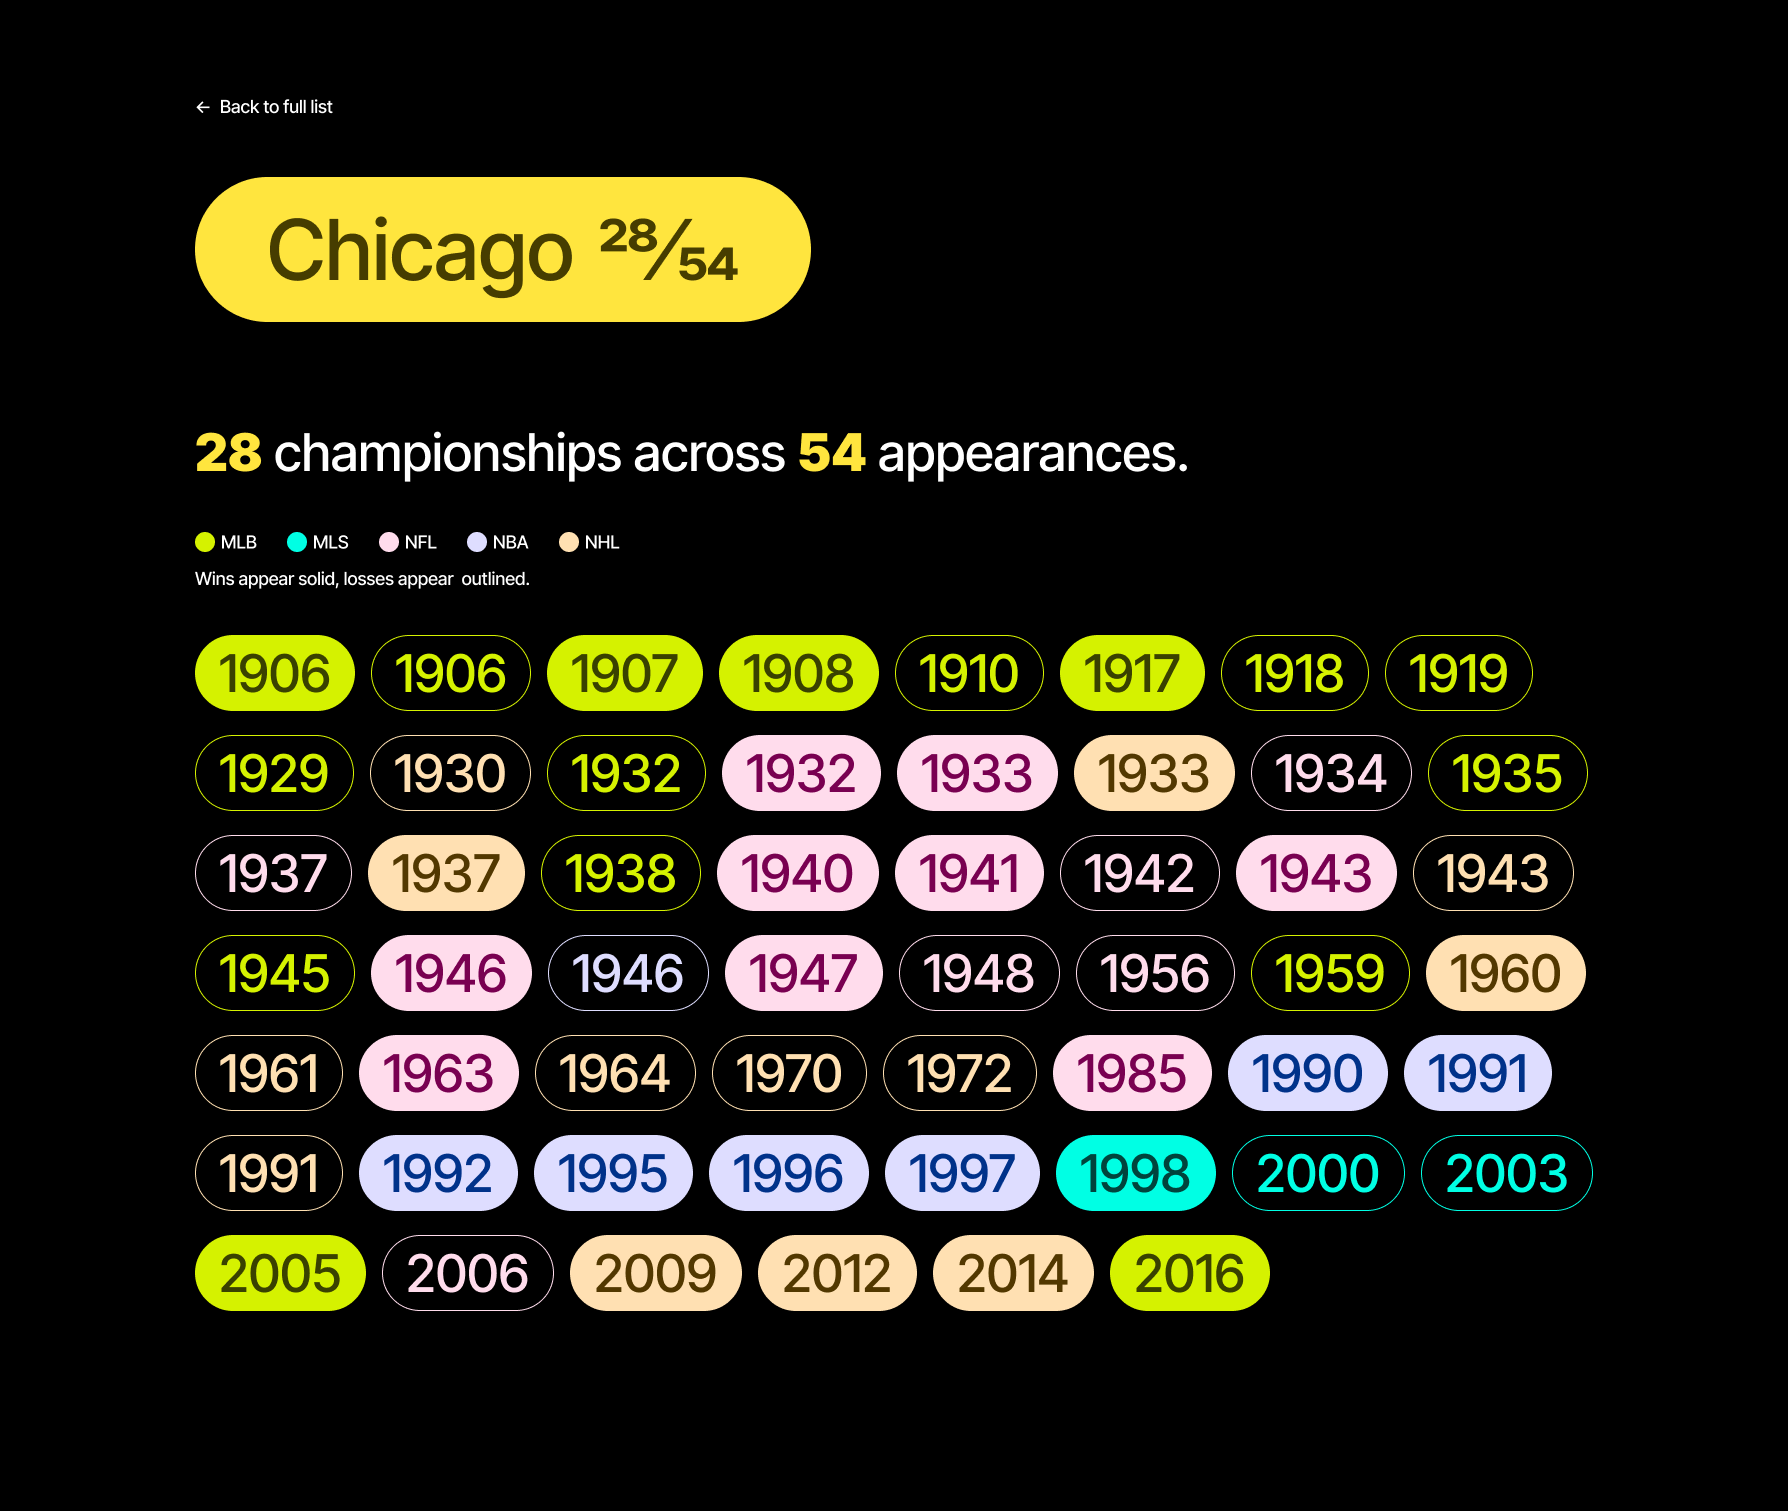
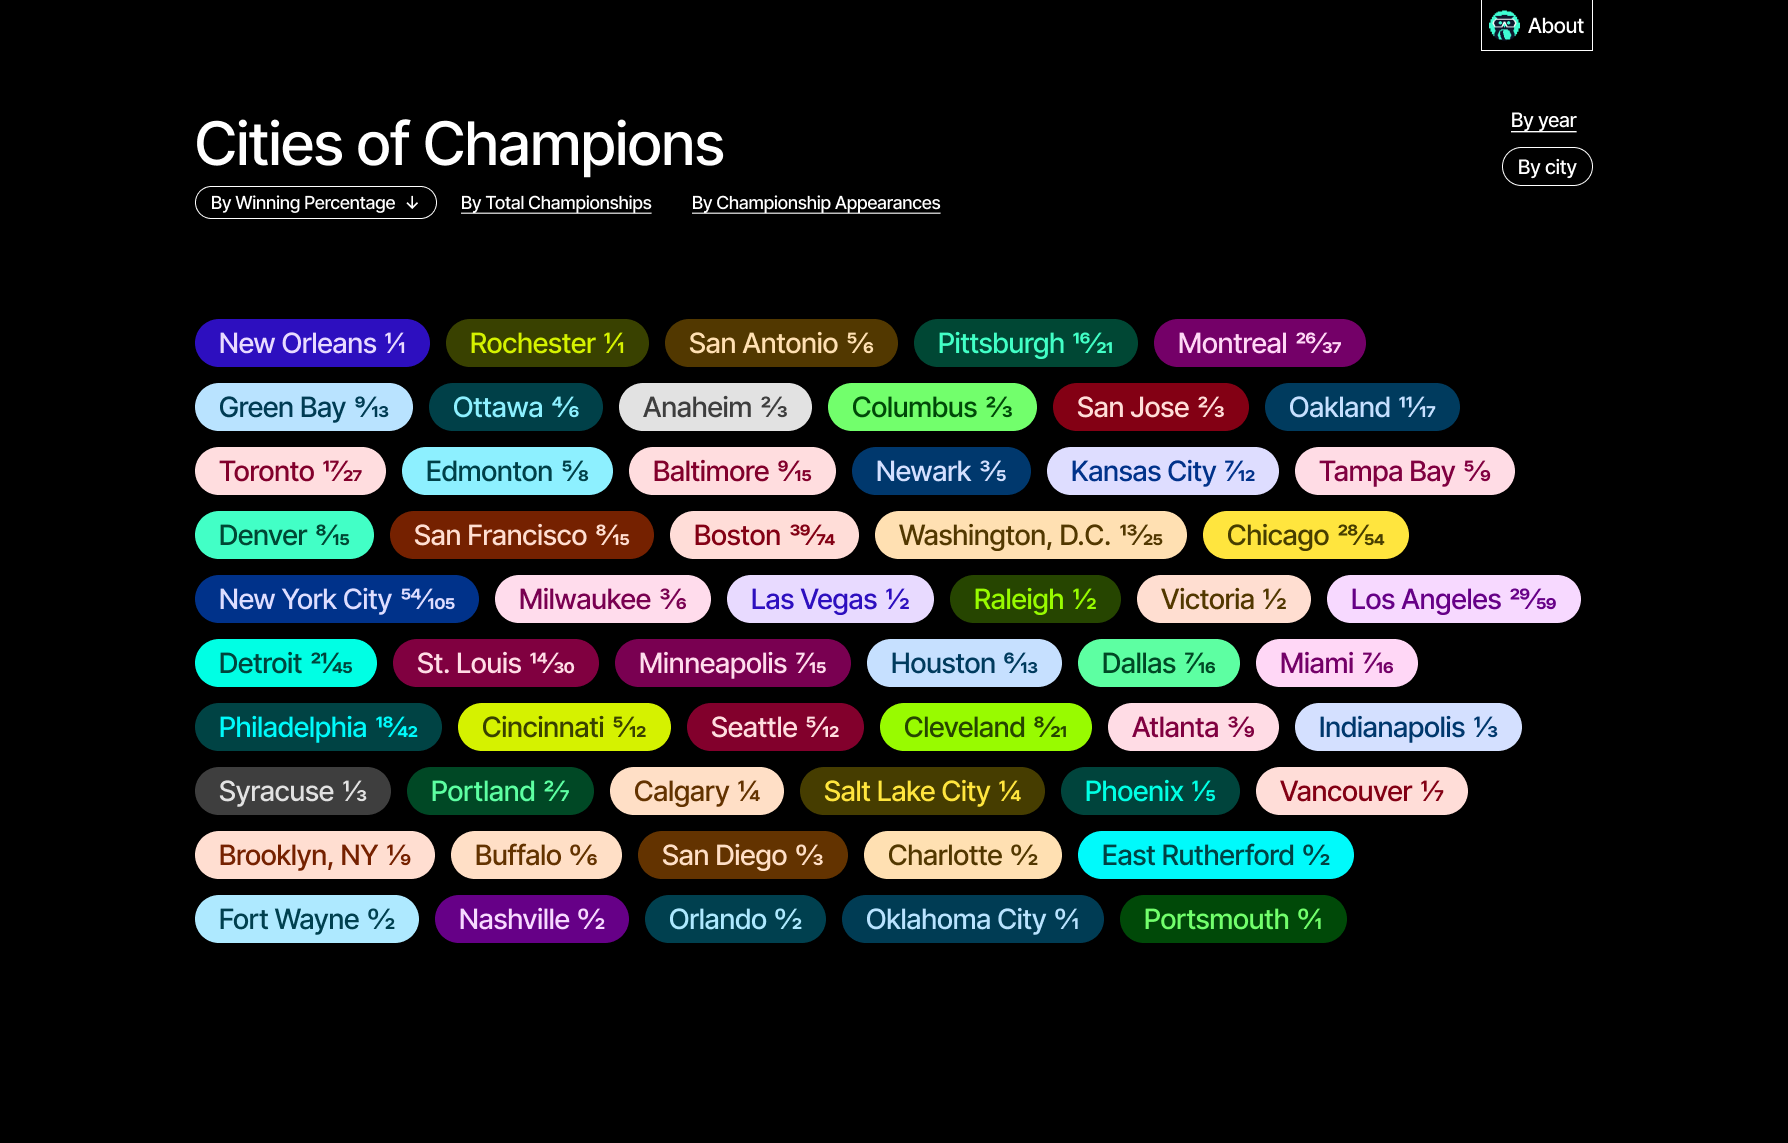
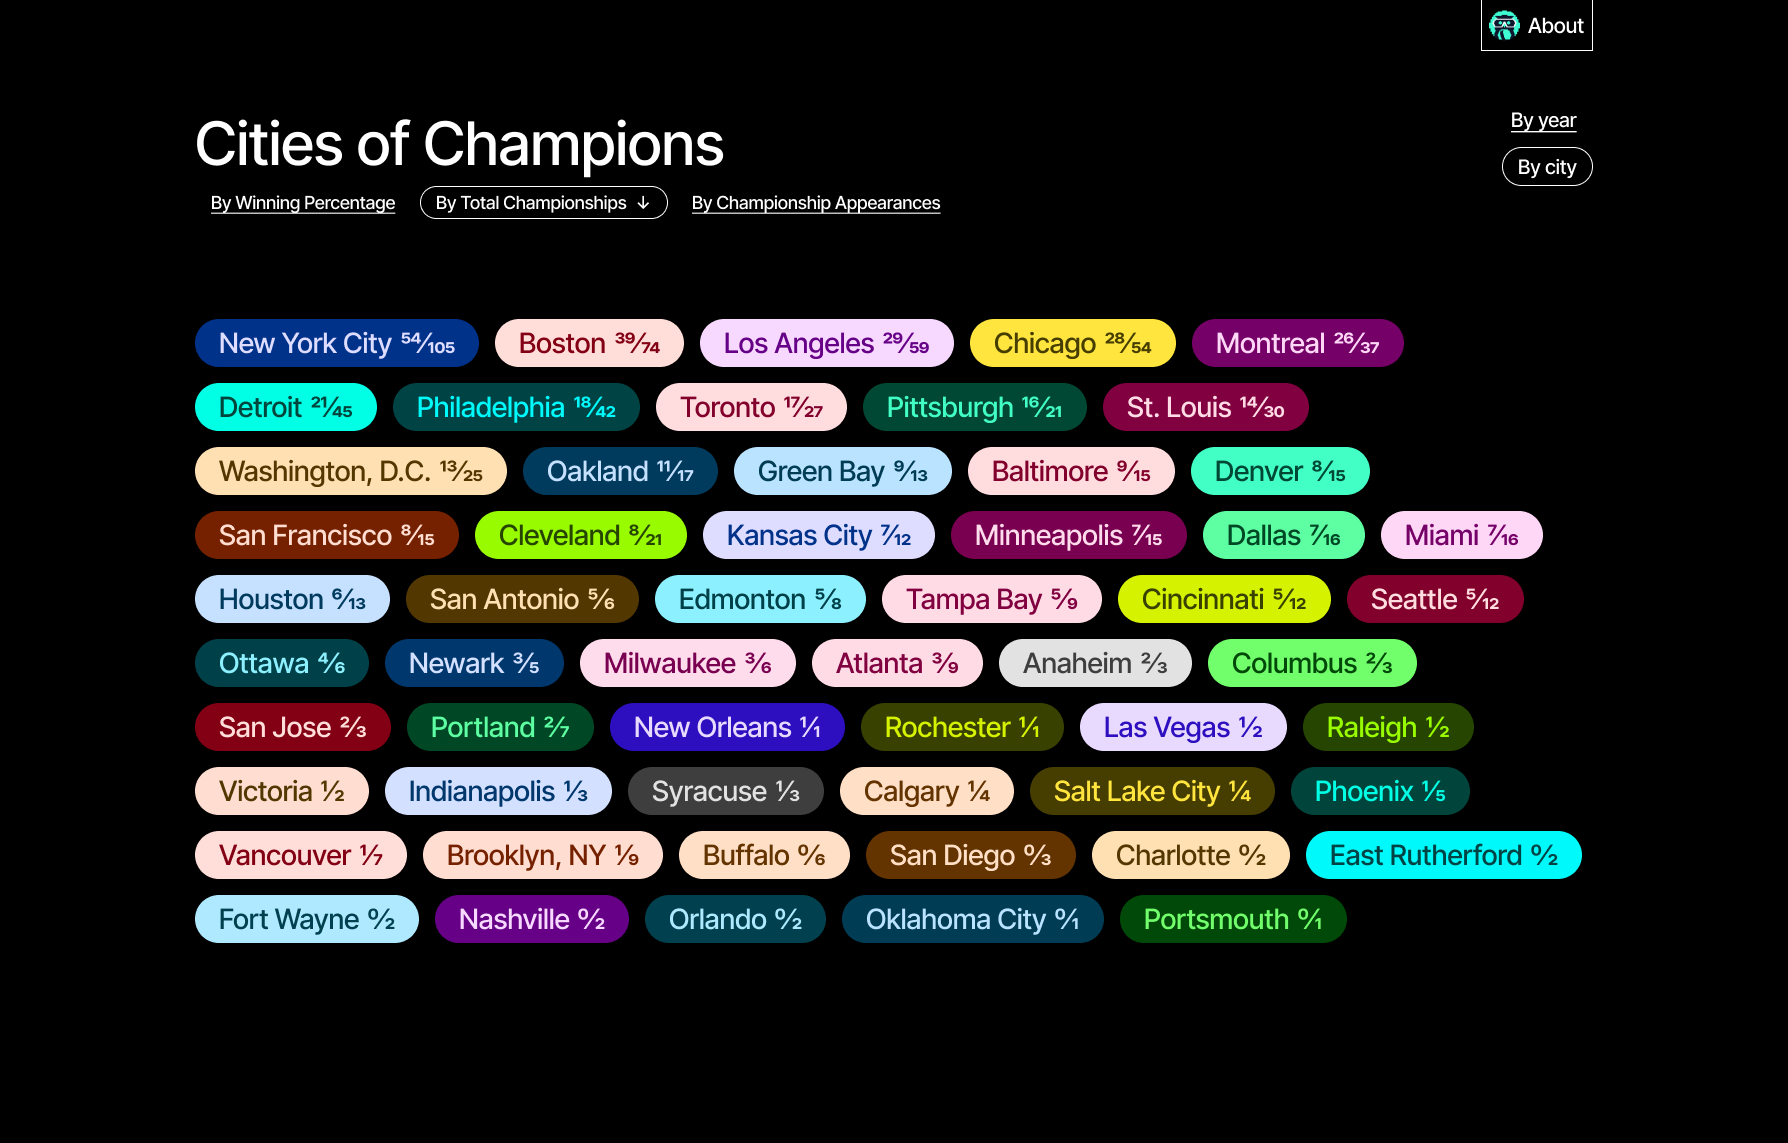
The result is a dynamic timeline showing the ebb and flow of success and near-success in the context of team location.
This idea was brought to life by my Savas Labs colleague, Matías Trunzo.
I want to talk about colors with you.

Design is for people.
©2025 Drew Glover. All work created by me unless specifically stated. No AI assistance used in any work on this site.
Built with WordPress, Semplice, and Figma. Typography used: MD Nichrome and AT Name Sans.
